How to Model Changes to Your Contributions and Boosters and View Results
Seeing What-If Scenarios for your Income Amplifier

With my Income Amplifier Model, you can see the effects of changes to your personal Income Amplifier.
Warning! My model is NOT THE SAME as the IRIS system created by George and the Fynanc team. If you are a Fynanc student, and you use my model, don’t ask Fynanc or CIS any questions about my system or how it works or why your numbers are this way or that! Bring your questions only to me! No one else knows how my system works. If you want an official change to your plan, then schedule an appointment with CIS.
Contemplating Changes to Your Income Amplifier Plan
Your Income Machine Tracking System includes one or more tabs to model an income amplifier. With a few settings you provide, these modeling tabs calculate how an income amplifier behaves, and you can view tables and graphs of monthly cash flow, unpaid balance, debt service coverage ratio (DSCR), cash flow rate, and much more.
By changing settings in the model, you change the behavior of the system, and you can see the results and compare them to another model or even the data collected for your actual income amplifier. Here are some of the ideas you can try.
Your model tab has a name, like Model_XXX and another, like Model_YYY. (You can have as many copies of the model as you want, but you might need help setting it up. Let me know if you want help.)
Here’s the the model tab looks like. In this case, the model tab name is Model_BB which I created when I made this template for a subscriber.
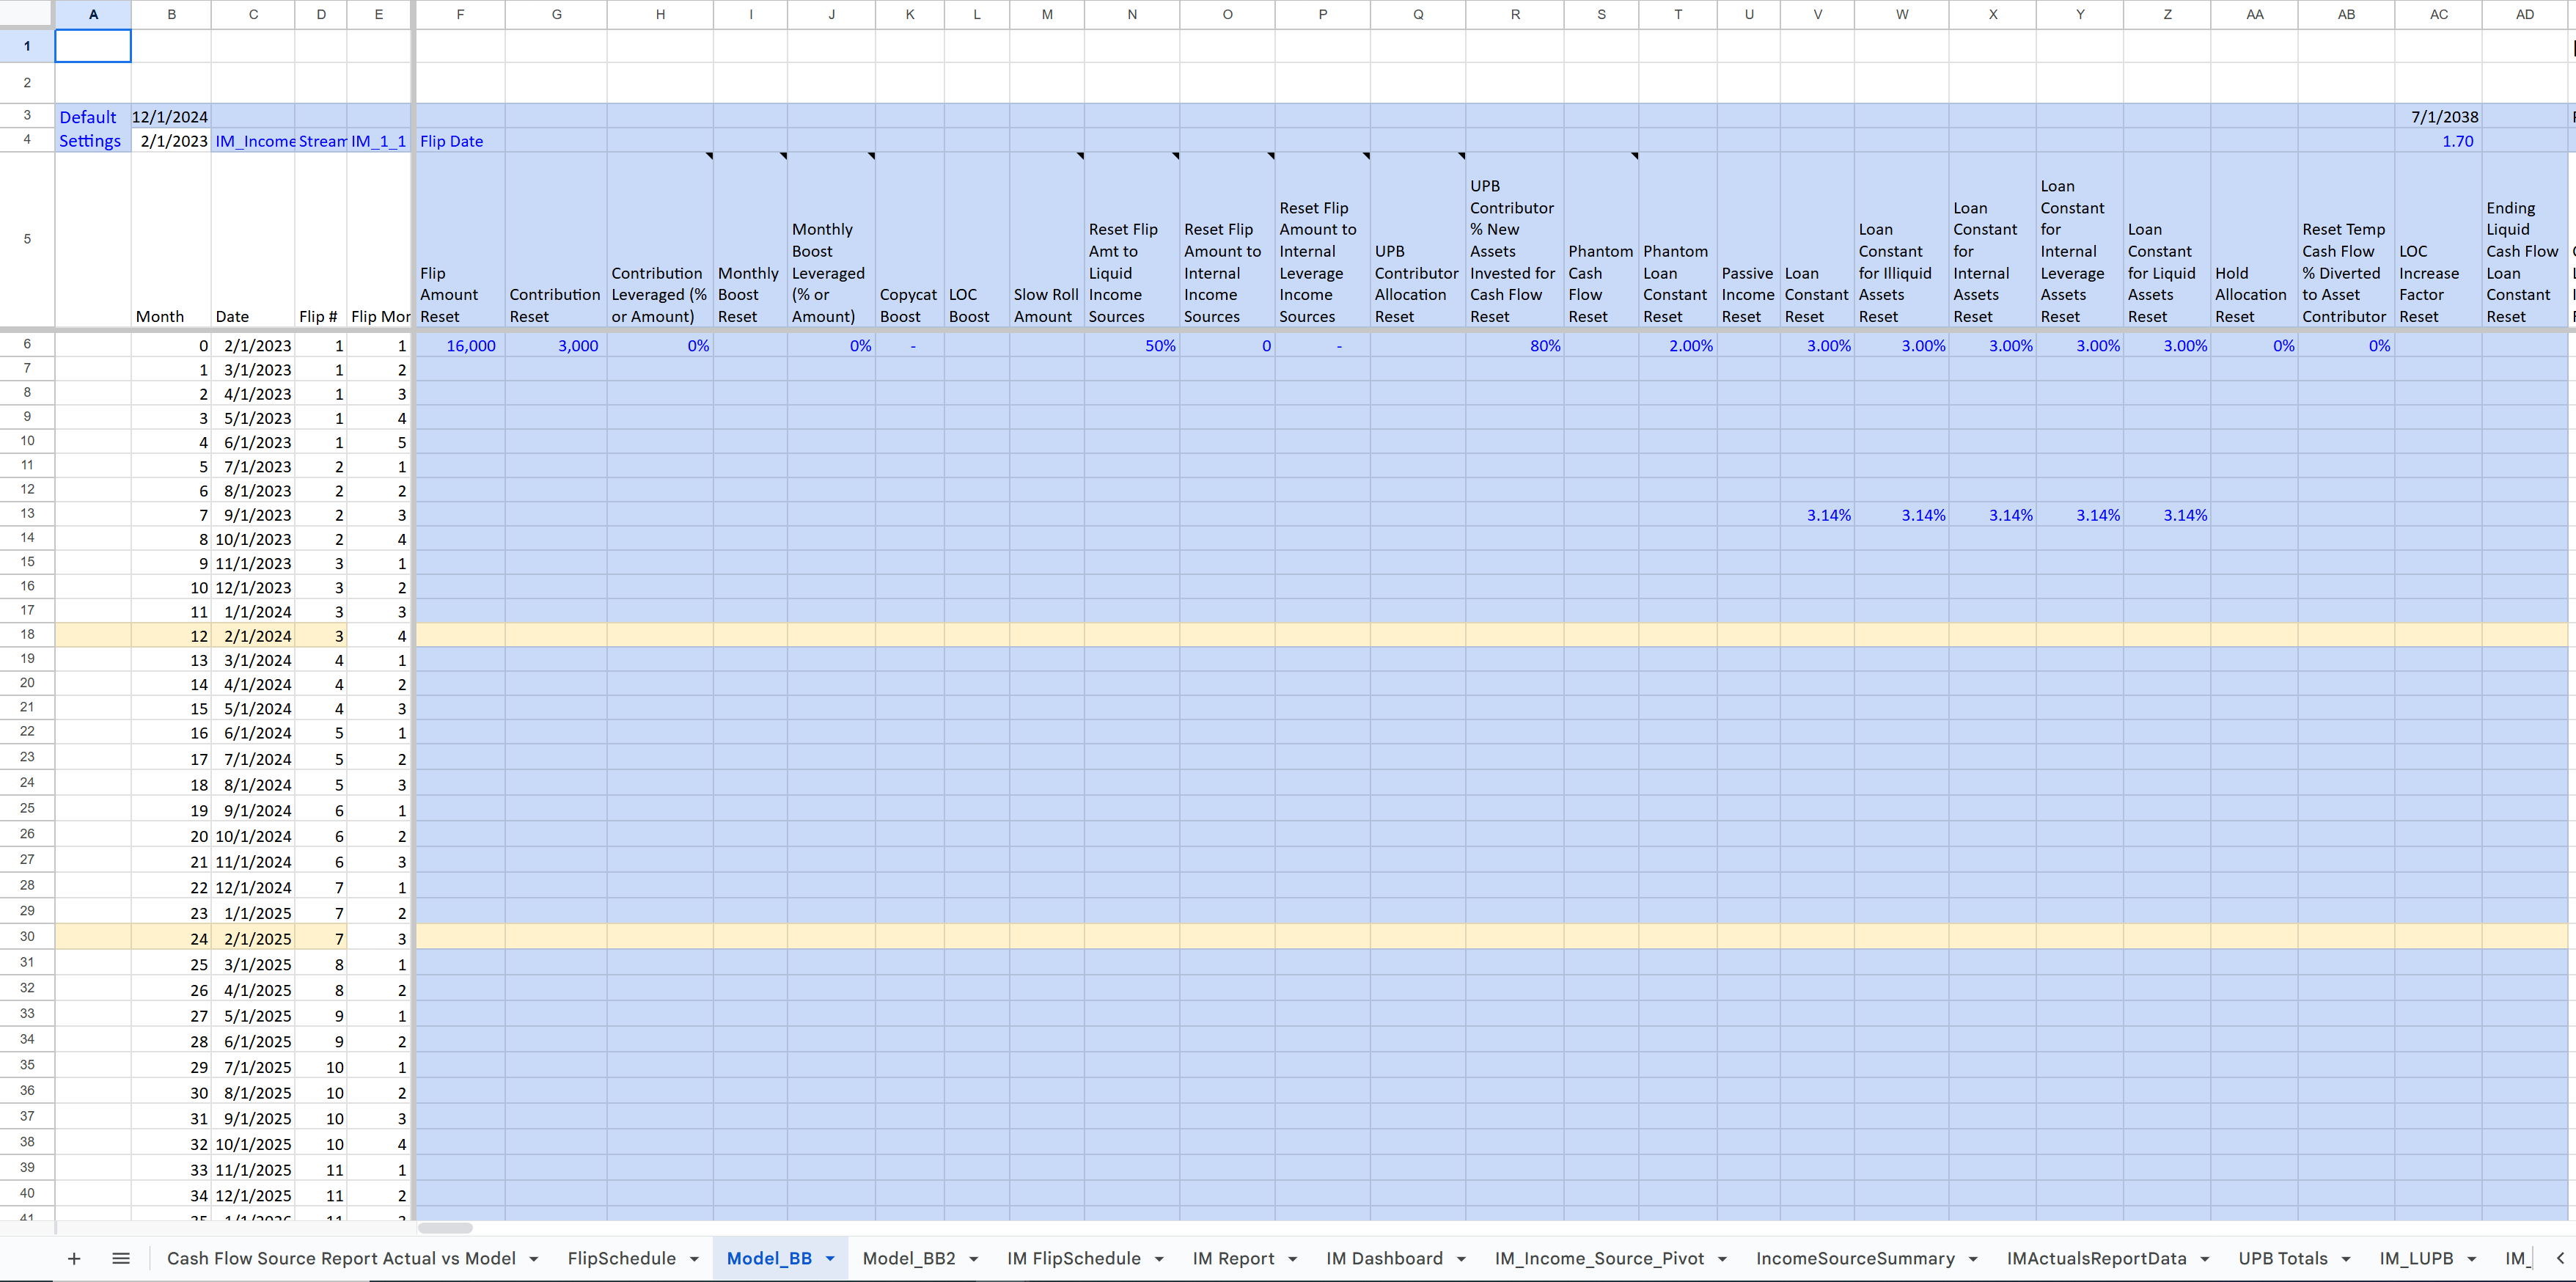
In this template, there are two model tabs, Model_BB and Model_BB2. You can make any changes to settings you want on these two tabs and then compare the results.
Settings you can change are in blue cells and have blue text.
Do not change any formulas or column titles, or your system might break.
Changing Model Settings
When I talk about making changes to your model, I am not talking about making real changes to your real system. I am talking about making changes to the model that make calculations and allows you to see data tables and graphs. Making changes to the model settings does not affect your tracking system in any way. Making changes to the model settings doesn’t mean you have to change anything about your real system in real life. Changing model settings is just for seeing what happens months or years down the road so you can play around and imagine “what if” as much as you want.
Furthermore, you can compare changes in one model to a another model, perhaps your original plan as a baseline, or perhaps a completely different set of changes.
It is also possible to compare a model to your real system performance and behavior.
Viewing Model Output
Several tabs in your tracking system display data tables and graphs of the model tabs. Any changes you make to settings change the calculations, and then the “reporting” tabs show the results. I will explain how to view results later in this post.
Next, let’s see how to change model settings.
How to Adjust Monthly Contributions
You can change your monthly contribution amount in your model in any month you want. The model assumes your intent is to change the monthly contribution to the new amount for every single month going forward until you change it again or stop the system.
To make this change, simply find the column Contribution Reset (column G), and navigate downward corresponding to the month and year in the column Date (column C). Then enter the new amount you wish to contribute each month. After the system recalculates, the projections for your system are reflected in the model. You can view the changes on any reporting tabs, such as Plan Summary, Plan Schedule, Plan Comparison, and others. (More details later in this post on how to customize your view of the model results.)
Boosters
There are several ways to use boosters.
One-time Boosters
To add a one-time booster, just enter the amount of the booster at the desired month and year for the setting LOC Boost (column L). This adds a payment to your line of credit in that month and year only, and it assumes you are adding your own capital, not borrowed capital.
A Booster Series
A booster series is a set of payments of one amount you specify to begin on a particular month and to end at a particular month. All payments go to your line of credit.
For example, to booster $300 each month for 10 months, starting April of 2025, do the following:
Find the row for April 2025 in column Date.
In that row, enter 300 for the setting Monthly Boost Reset. You do not have to enter $300 for any following months. The system assumes the booster will continue until it finds a new change to the setting.
To end the booster series, enter 0 for the setting Monthly Boost Reset for the month after the last booster payment you intend to make. For this example, the tenth payment would be made February of 2026, so the setting to end the booster series would be 0 placed in month March of 2026.
Note there is no limit to the number of booster series you can add or change. You can have a break and then another series later with a different amount, and you can have just about any combination you can think of.
Copycat Booster
A copycat booster adds an amount to your unpaid balance with new monthly cash flow payment at your cash flow rate setting to your line of credit.
To add a $10,000 copycat booster to your plan, starting May 2025, follow these steps:
Find the row for May 2025 in column Date.
In that row, enter 10,000 for the setting Copycat Boost (column K).
To verify the copycat booster, you can check column New Invested for month May 2025 for the value ($10,000). (If you have a new flip the same month, then you would see that the New Invested value is the flip amount plus the copycat amount.) The column New Cash Flow will also show a new cash flow payment of $300 in the month following the copycat, June 2025 in this example. (Note: The settings for Loan Constant (columns V-Z, covering all different asset and income source types) is 3% in this example.)
Pre-Flip Boosters
When I’m close to the next flip, I almost always boost to get to the next flip a month earlier. Let’s think about the process. Every month, you have your monthly contribution and your monthly cash flow. I make my contributions and cash flow payments near the beginning of the month. If my credit line is fully paid as a result of those payments, I will flip immediately.
If my contribution and regular cash flow payments leave the credit line just short, then I will boost and flip immediately.
Looking at the column IRIS LOC Balance, find a cell where the balance is low, but still negative. How low? First, there is a setting in cell BL4 with a negative number, say ($1000). The model assumes that if the balance is smaller (closer to zero), than that amount, then it’s time to flip. It doesn’t wait until the balance is actually zero or above. It flips slightly early, but it does not add a booster. It just flips early, which means the LOC balance after a flip potentially could be larger than the flip size. The amount remaining on the credit line balance before the flip is still there. For modeling purposes, to get to the next flip, your booster only has to put the balance past that ($1000) threshold. (You can change that threshold to whatever you want for flipping early.) For the purpose of your real system, you simply decide whether you want to flip early (the credit line balance is not quite zero), or you want your booster to make the credit line zero.
To summarize the steps,
Find a low credit line balance (close to zero but still negative) in column IRIS LOC Balance. This balance should be above the threshold (farther from zero) for flipping early, cell BL4.
If desired, adjust the threshold for early flipping in cell BL4. It’s ($1000) by default, but you can change it to anything, including zero (no early flipping).
Add a booster amount in column LOC Booster in the same month as the low credit line balance you found.
The next flip and New Invested will be in the following month. (I don’t have a way yet to make the next flip happen in the same month - technical spreadsheet stuff.)
How to View Model Results
Your template includes several reporting tabs for viewing results.
Plan Summary
Plan Flip Schedule
Plan Comparison
Flip Schedule Compare
Plan vs Actual Summary
UPB Allocation Report Actual vs Model
UPB Report Actual vs Expected
Cash Flow Source Report Actual vs Model
FlipSchedule
(I am still working on which tabs are most useful. Your feedback is welcome! It is possible to create more reporting tabs and customize exactly what data and graphs you wish to see.)
Plan Summary
To view model results, navigate to the tab Plan Summary.
If you are using more than one model tab, make sure cell B1 on this tab has the name of the model tab you want to view. (The text of that cell must match the model tab name exactly!) The Plan Summary tab displays the results of any model tab with any changes to settings as long as the model tab to display was copied from the original model tab in your template, and the column names have not been modified.
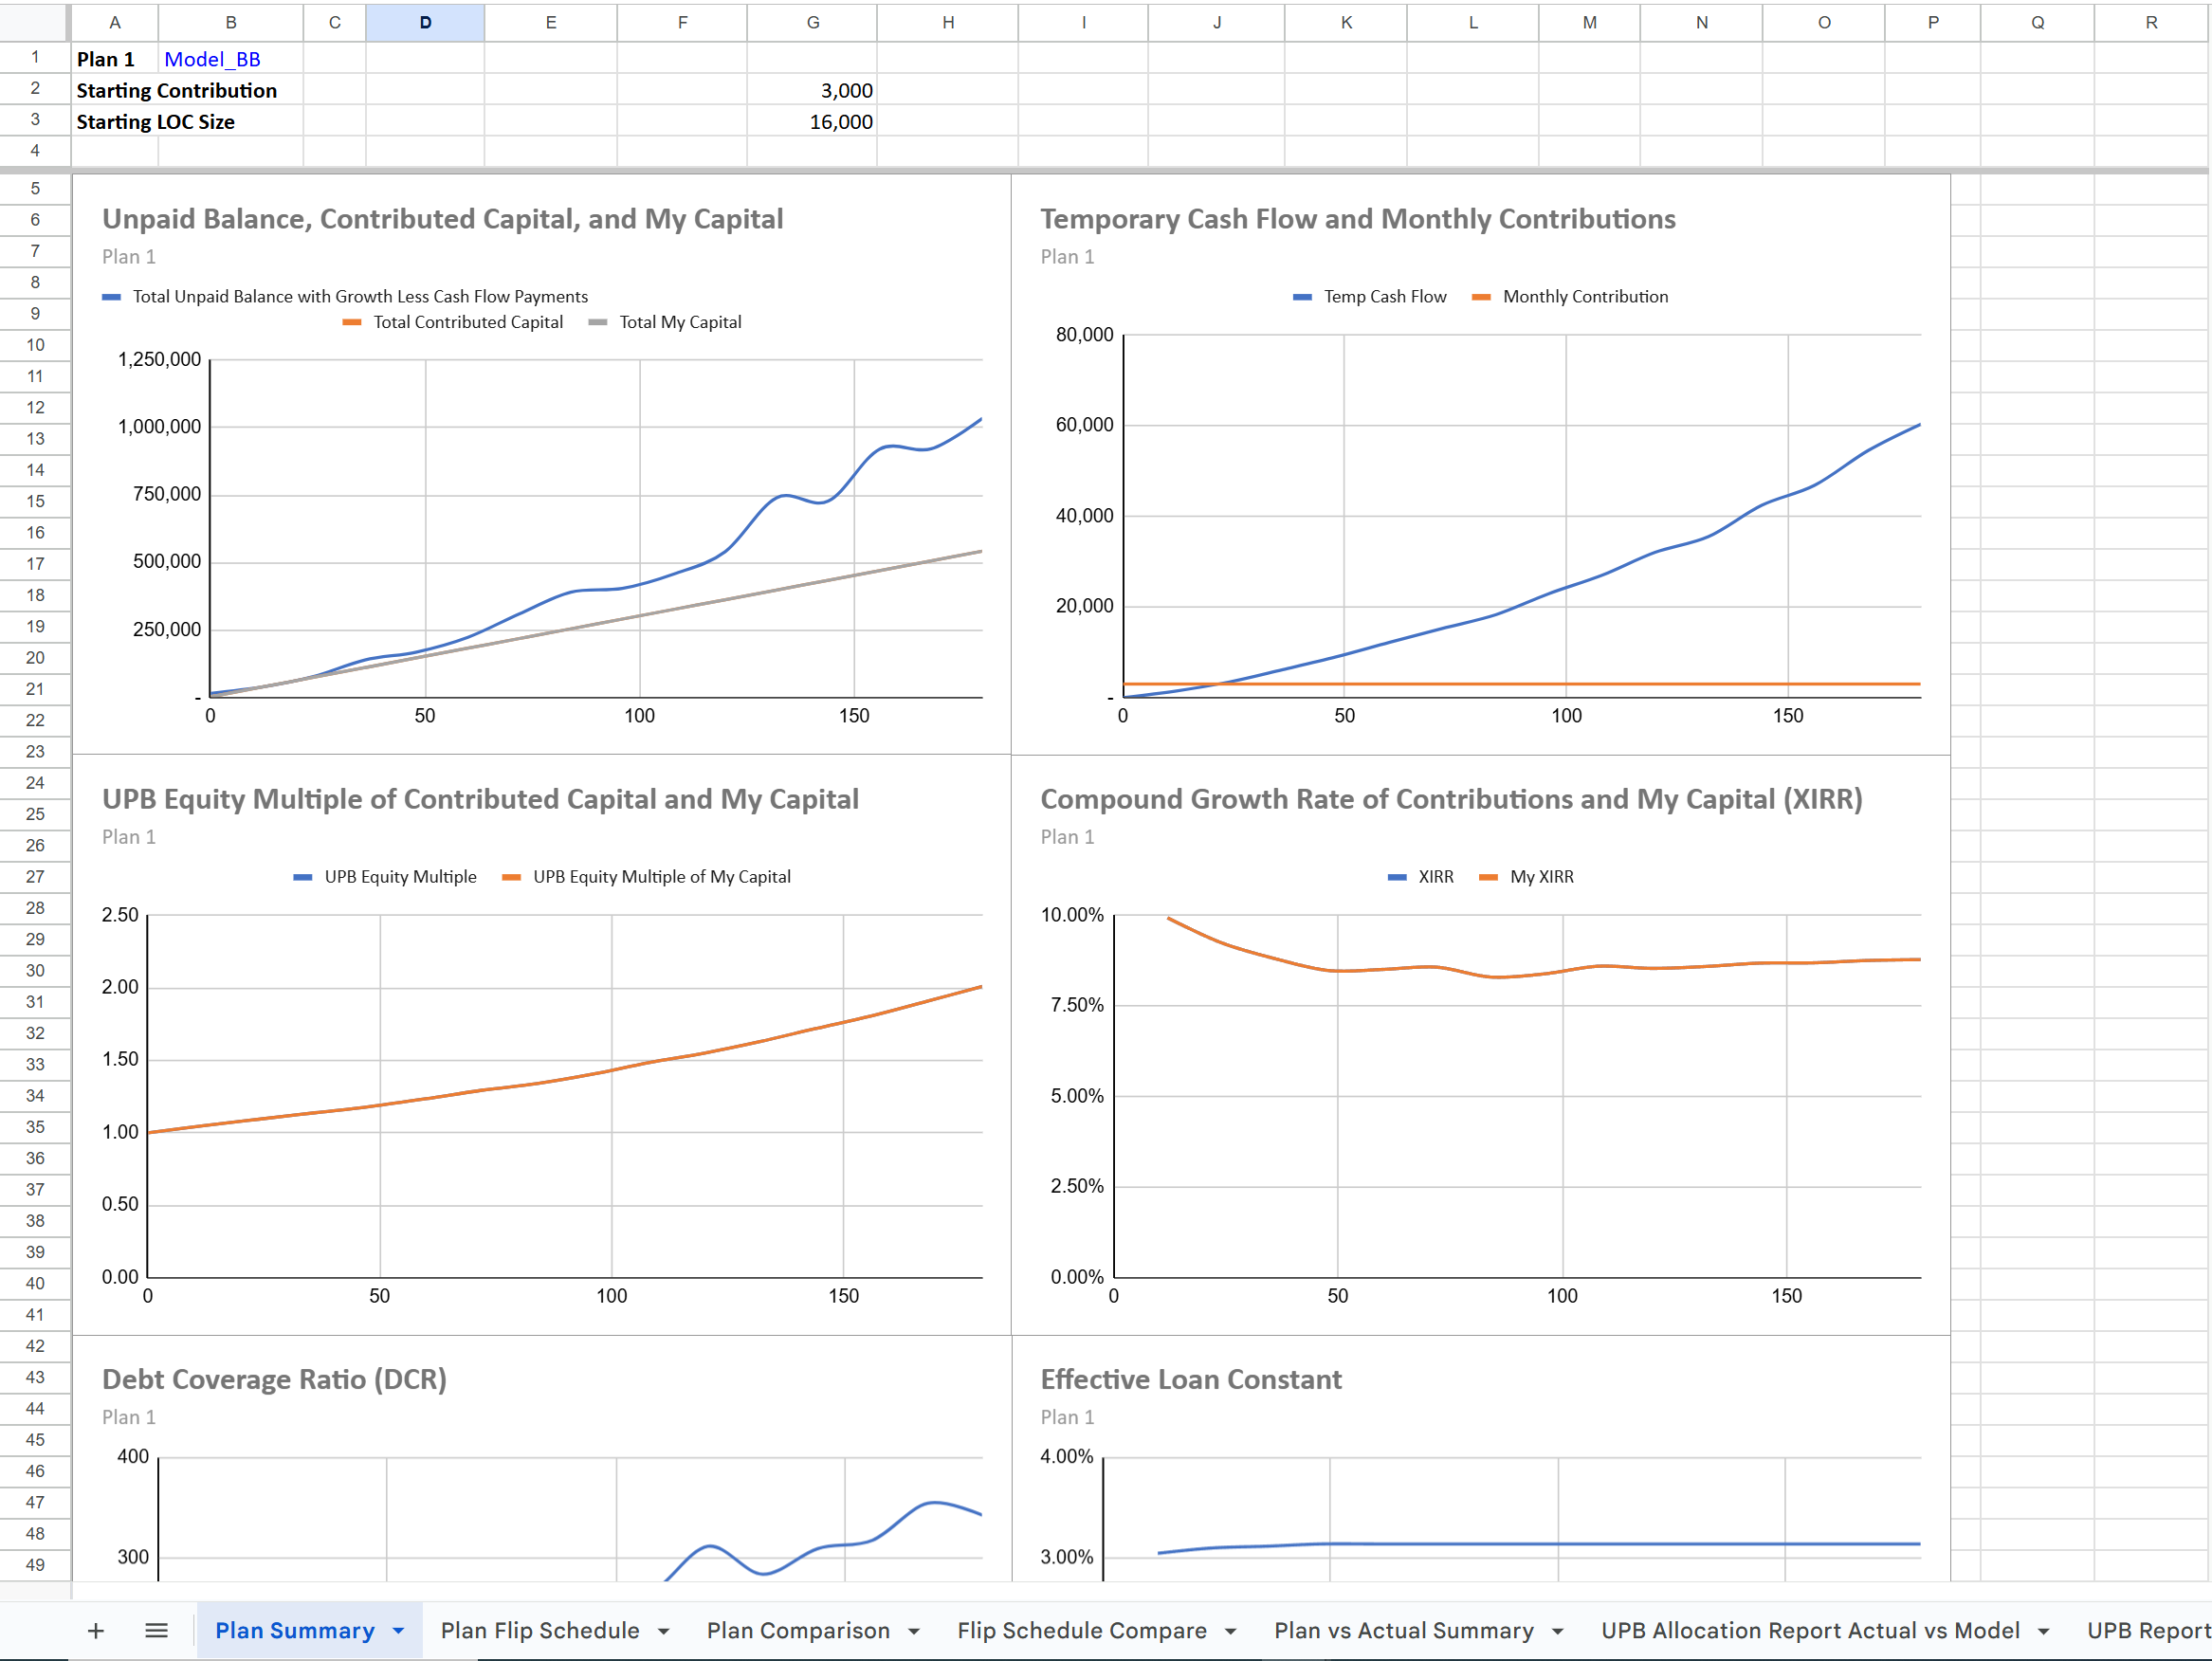
Plan Summary includes several graphs. The horizontal units is months.
Unpaid Balance, Contributed Capital, and My Capital
Unpaid balance is the line on top.
Total Contributed Capital and Total My Capital are the same unless you use leverage for contributions. If you use leverage, then Total My Capital will be less than Total Contributed Capital.
Temporary Cash Flow and Monthly Contributions
Shows a flat line for monthly contributions and the exponential growth of your monthly cash flow payments. (Of course, the flat line for contributions changes if you have changed the settings!)
UPB Equity Multiple of Contributed Capital and My Capital
UPB Equity Multiple of Contributed Capital is the total Unpaid Balance divided by the total amount of capital contributed. The whole point of the income amplifier is to grow your UPB faster than simply saving your capital. The line should be going up, and it should be exponential, not a straight line. Your UPB equity multiple is amplifying.
If you use leverage for contributions, then there are two lines. One is the multiple of all contributed capital. The other is the multiple of your capital.
Compound Growth Rate of Contributions and My Capital (XIRR)
Displays the annual compound growth rate of all contributed capital and your capital (separately only if you used leverage for contributions).
Changing the Time Period of the Data Table and Graphs
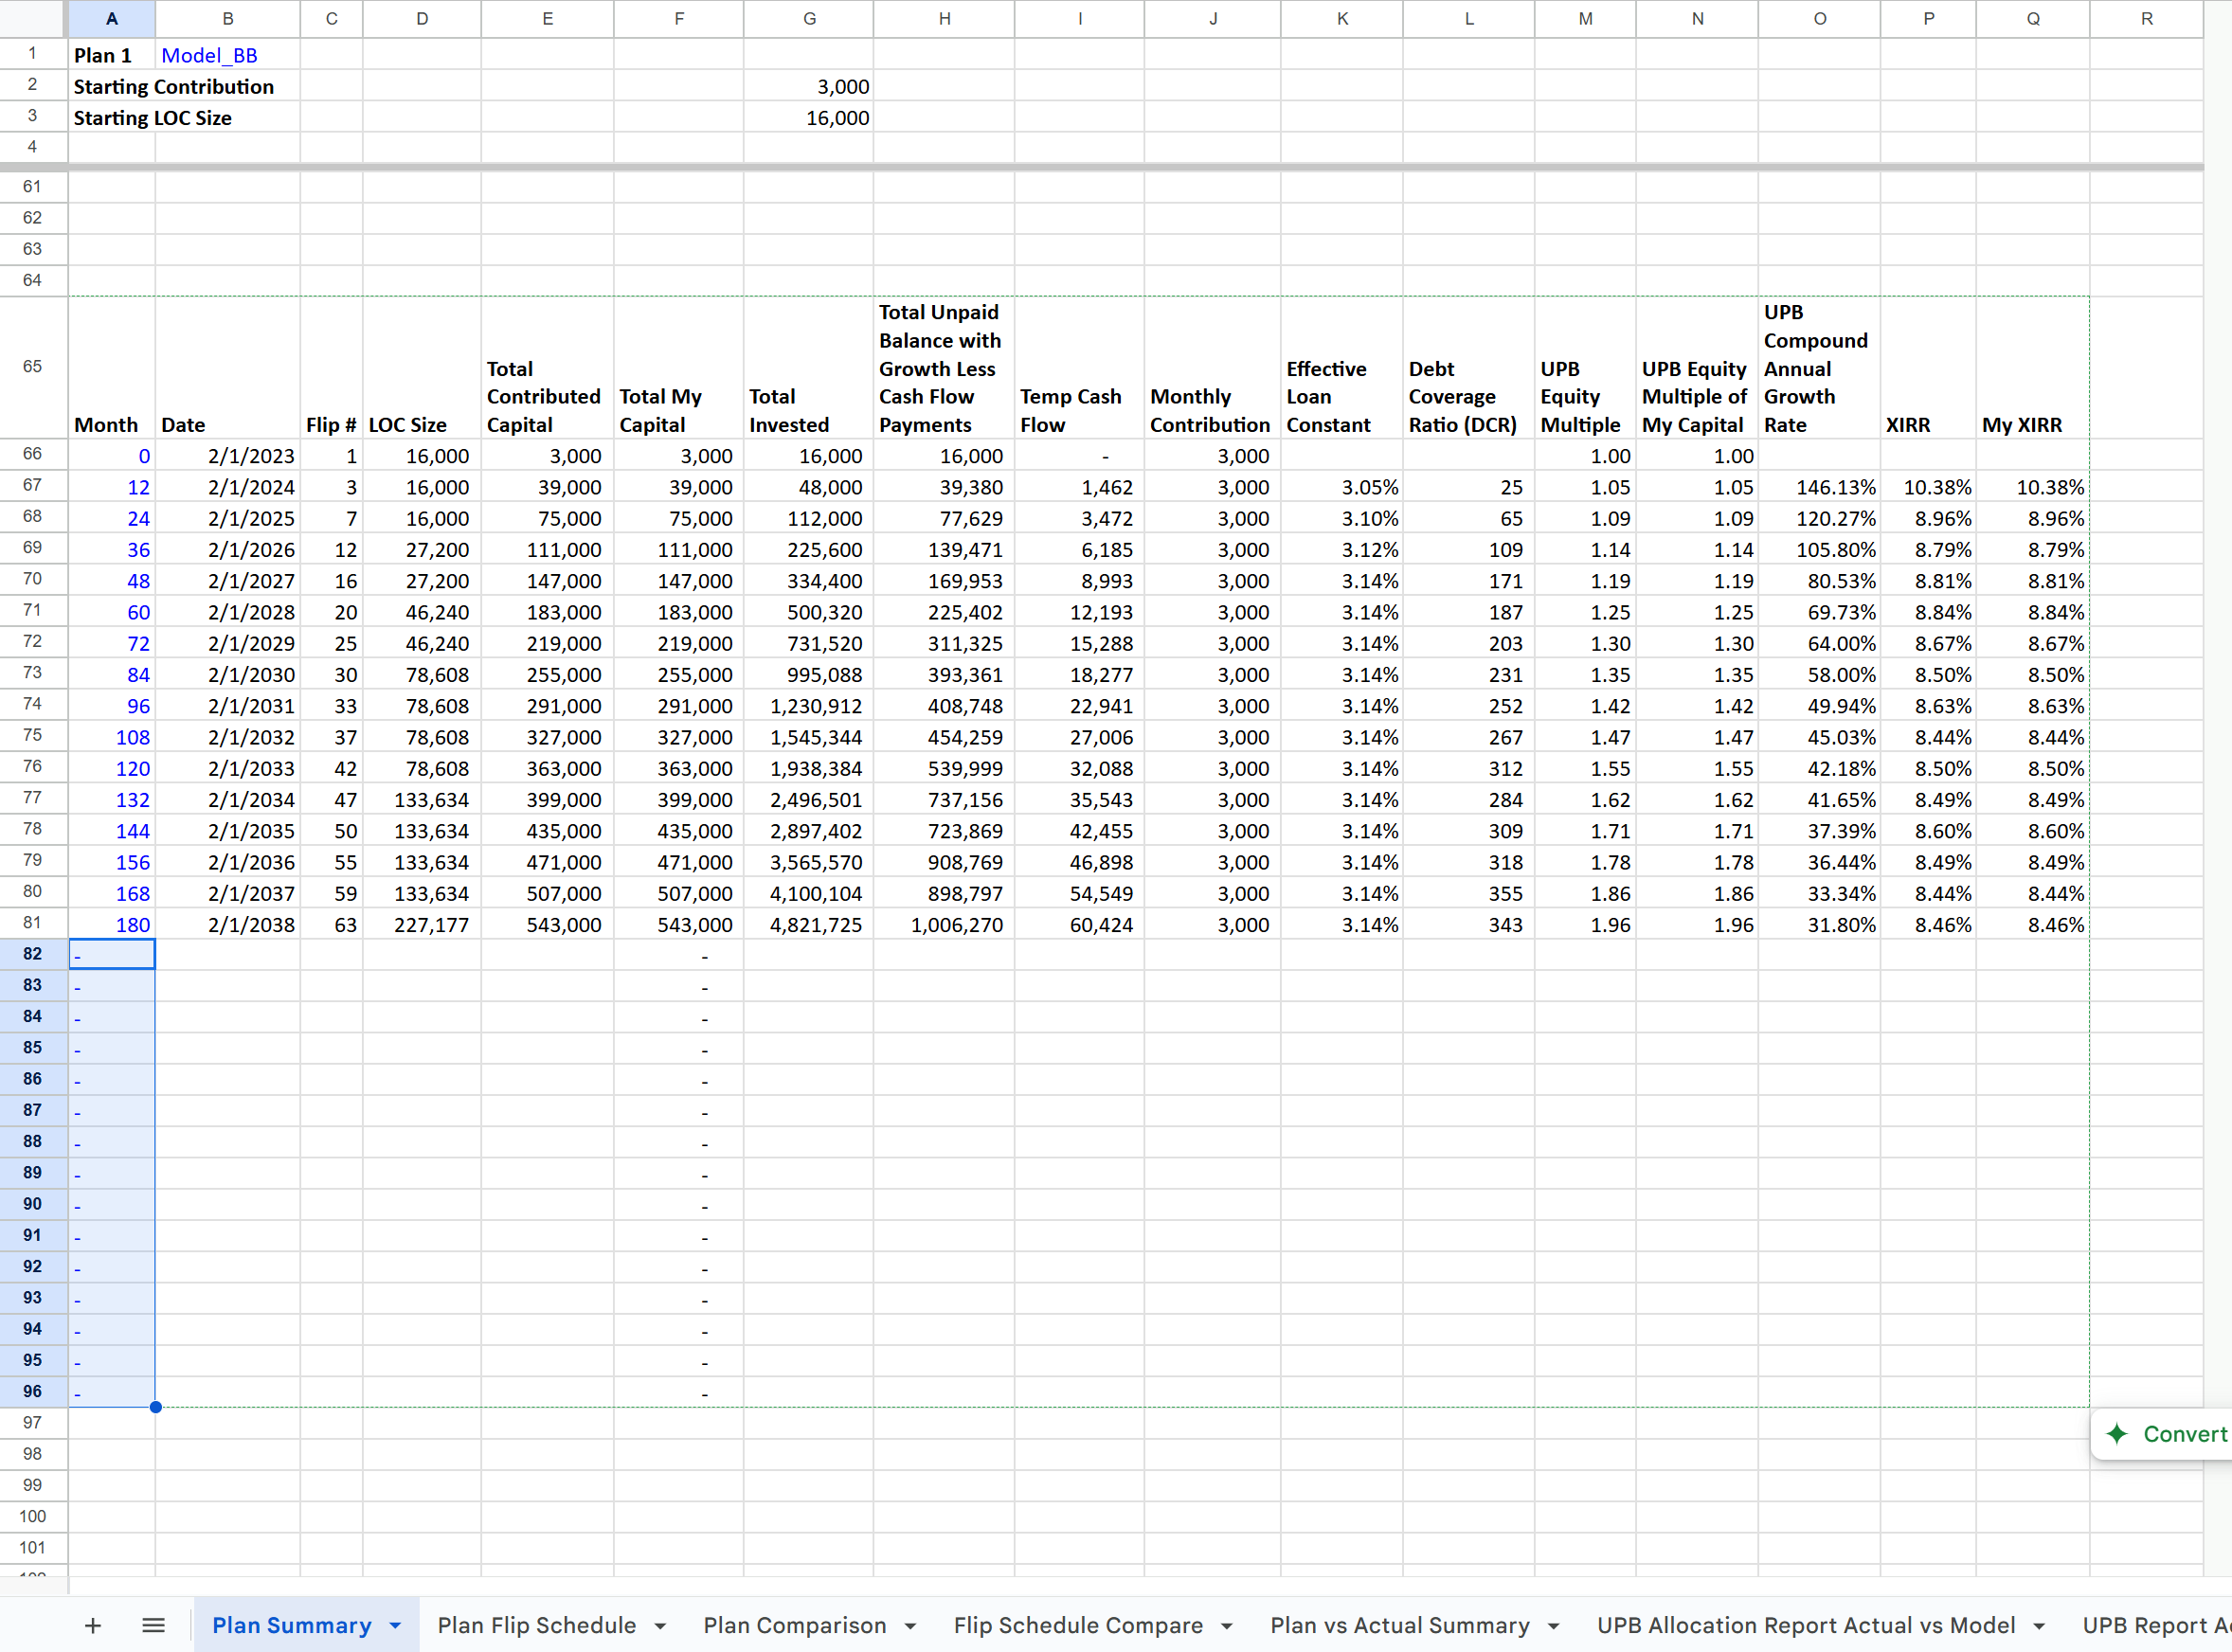
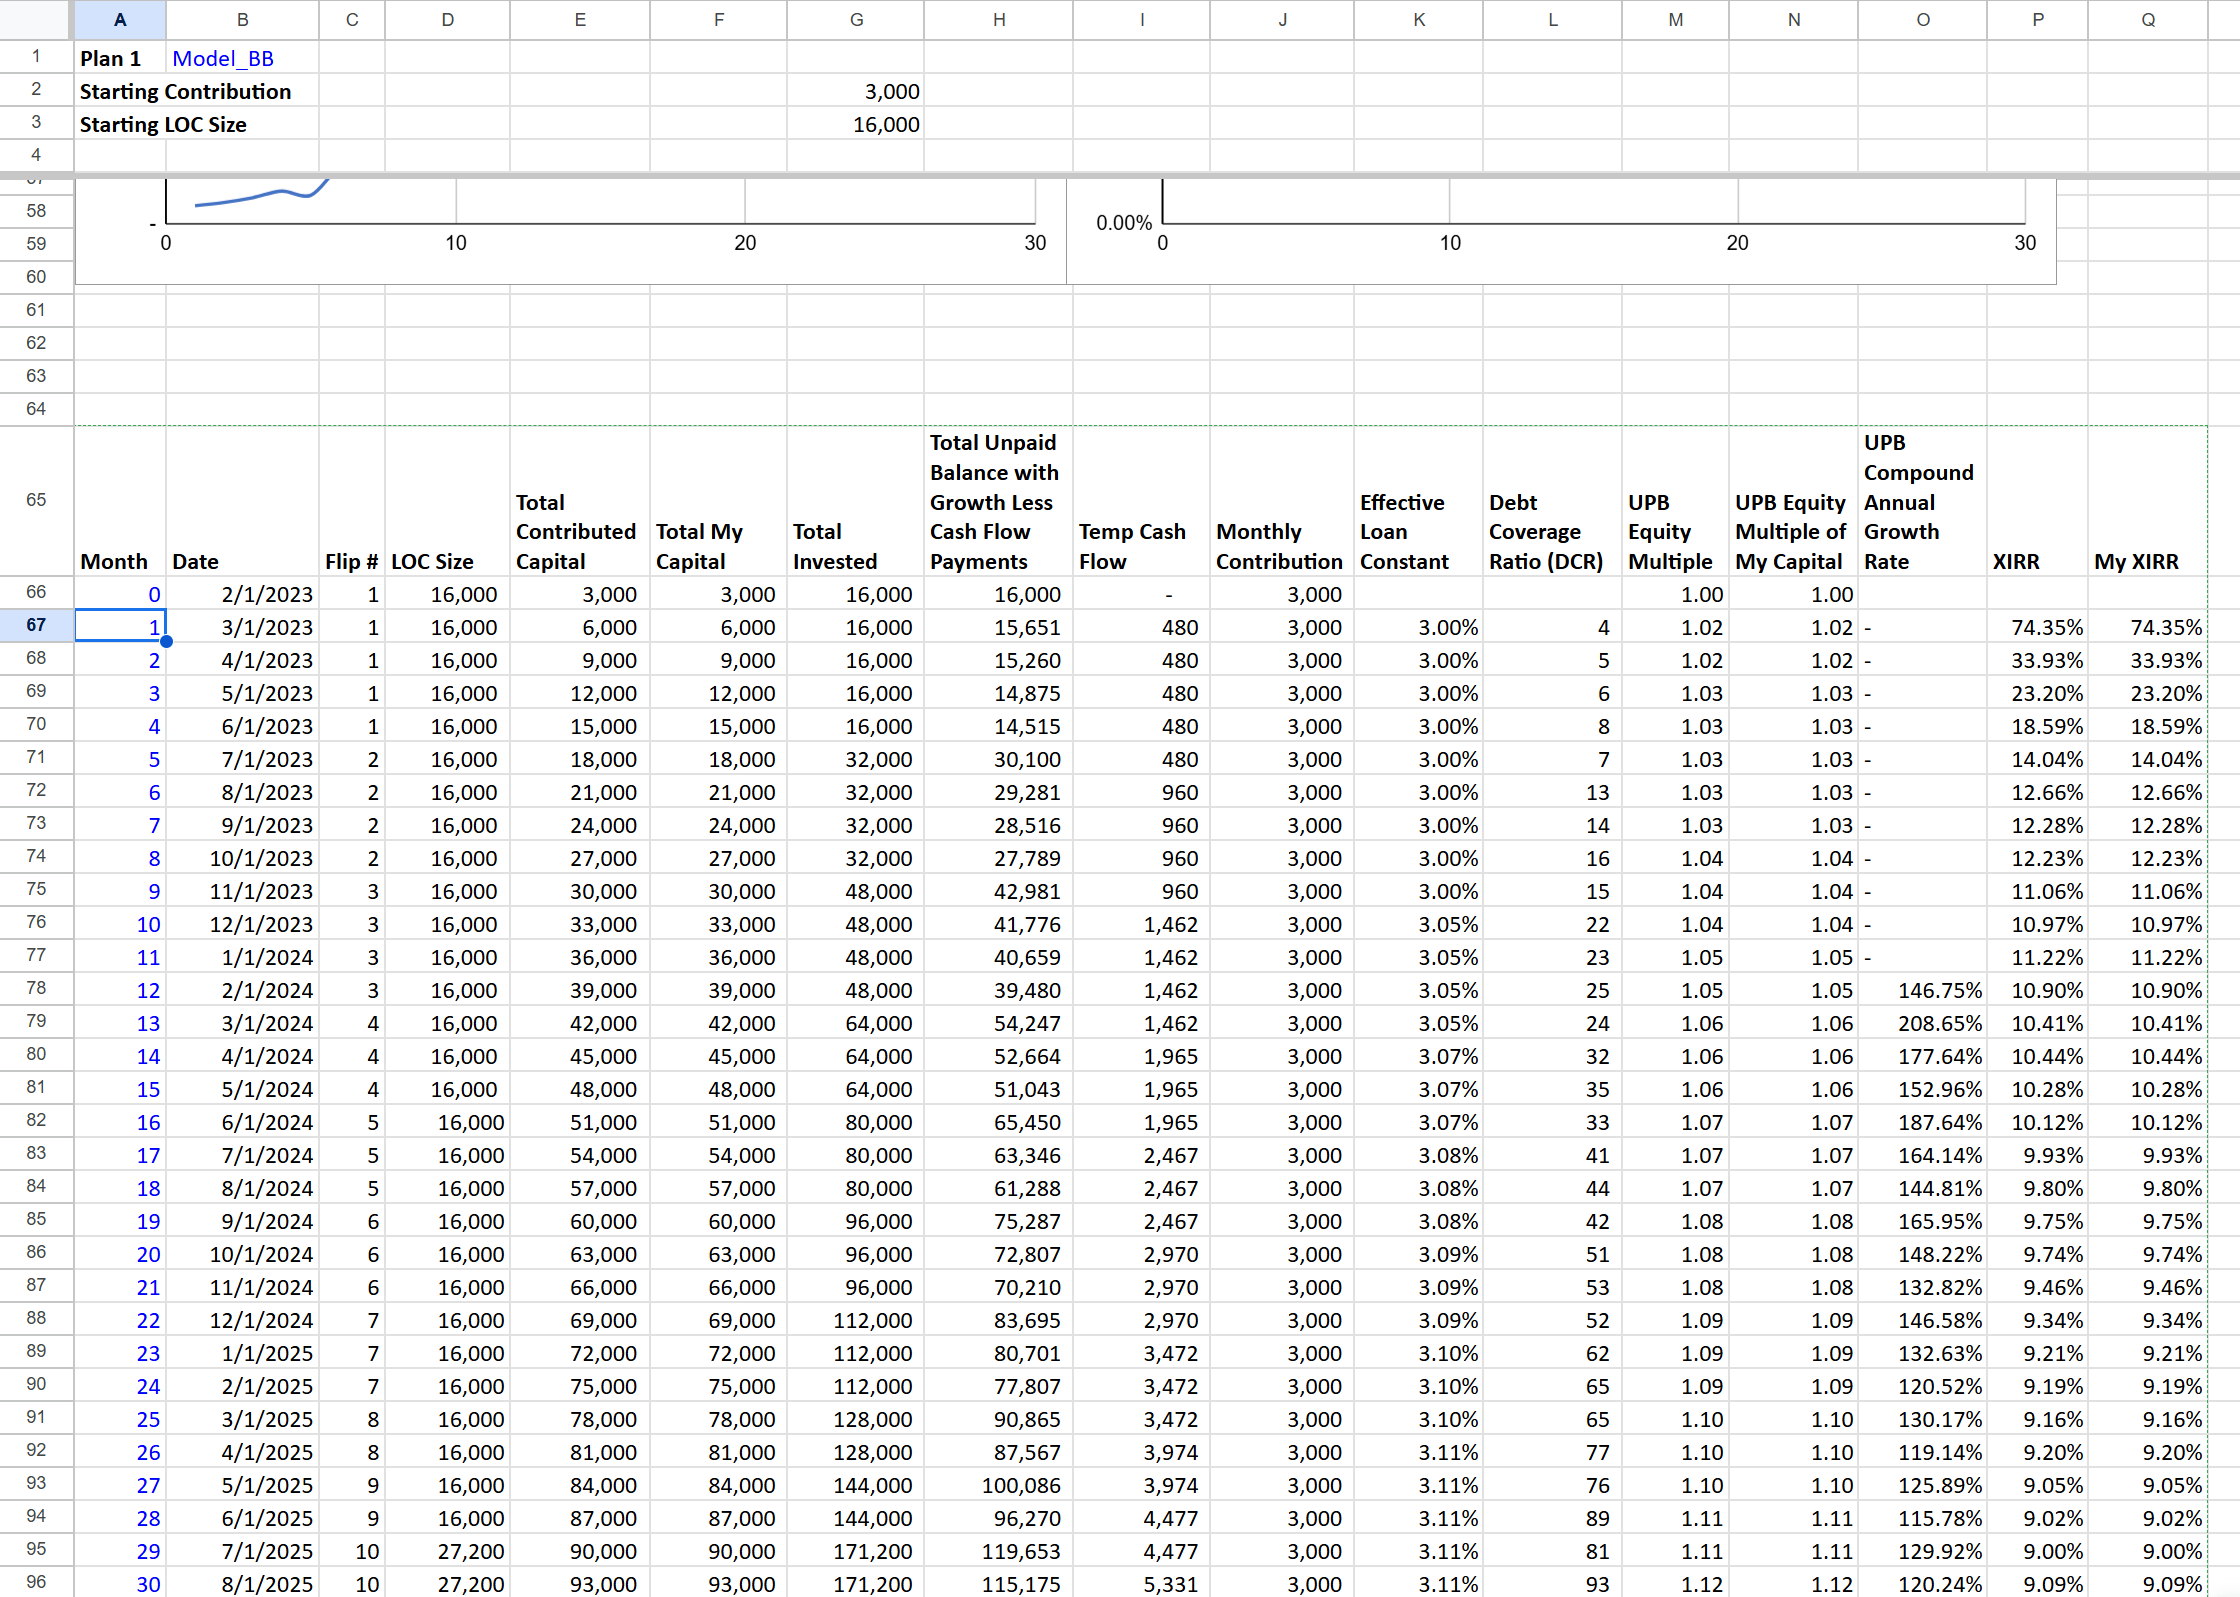
The model calculates for 180 months. You can customize the range of months to view by changing the blue text in the Date column (column A) in the data table below the graphs. The default time period is 180 months, and each row samples the data from the model at the month number indicated in the cell. By default, the data table takes data from the model by year: months 0, 12, 24, 36, 48, etc. You can change the month numbers in the Date column.
To zoom in on data for the first 3 years, you could enter the following:
Enter 0, 1, 2, 3 vertically in the first 4 cells of the Month column (cells A66-A69) below the graphs
Then select the 1, 2, 3 cells (cells A67-A69)click and drag to extend the values down to cell A96.
The table should show blue values 0-30 in the Month column, and the data should have been copied from the model. The graphs automatically update with the data in the data table.
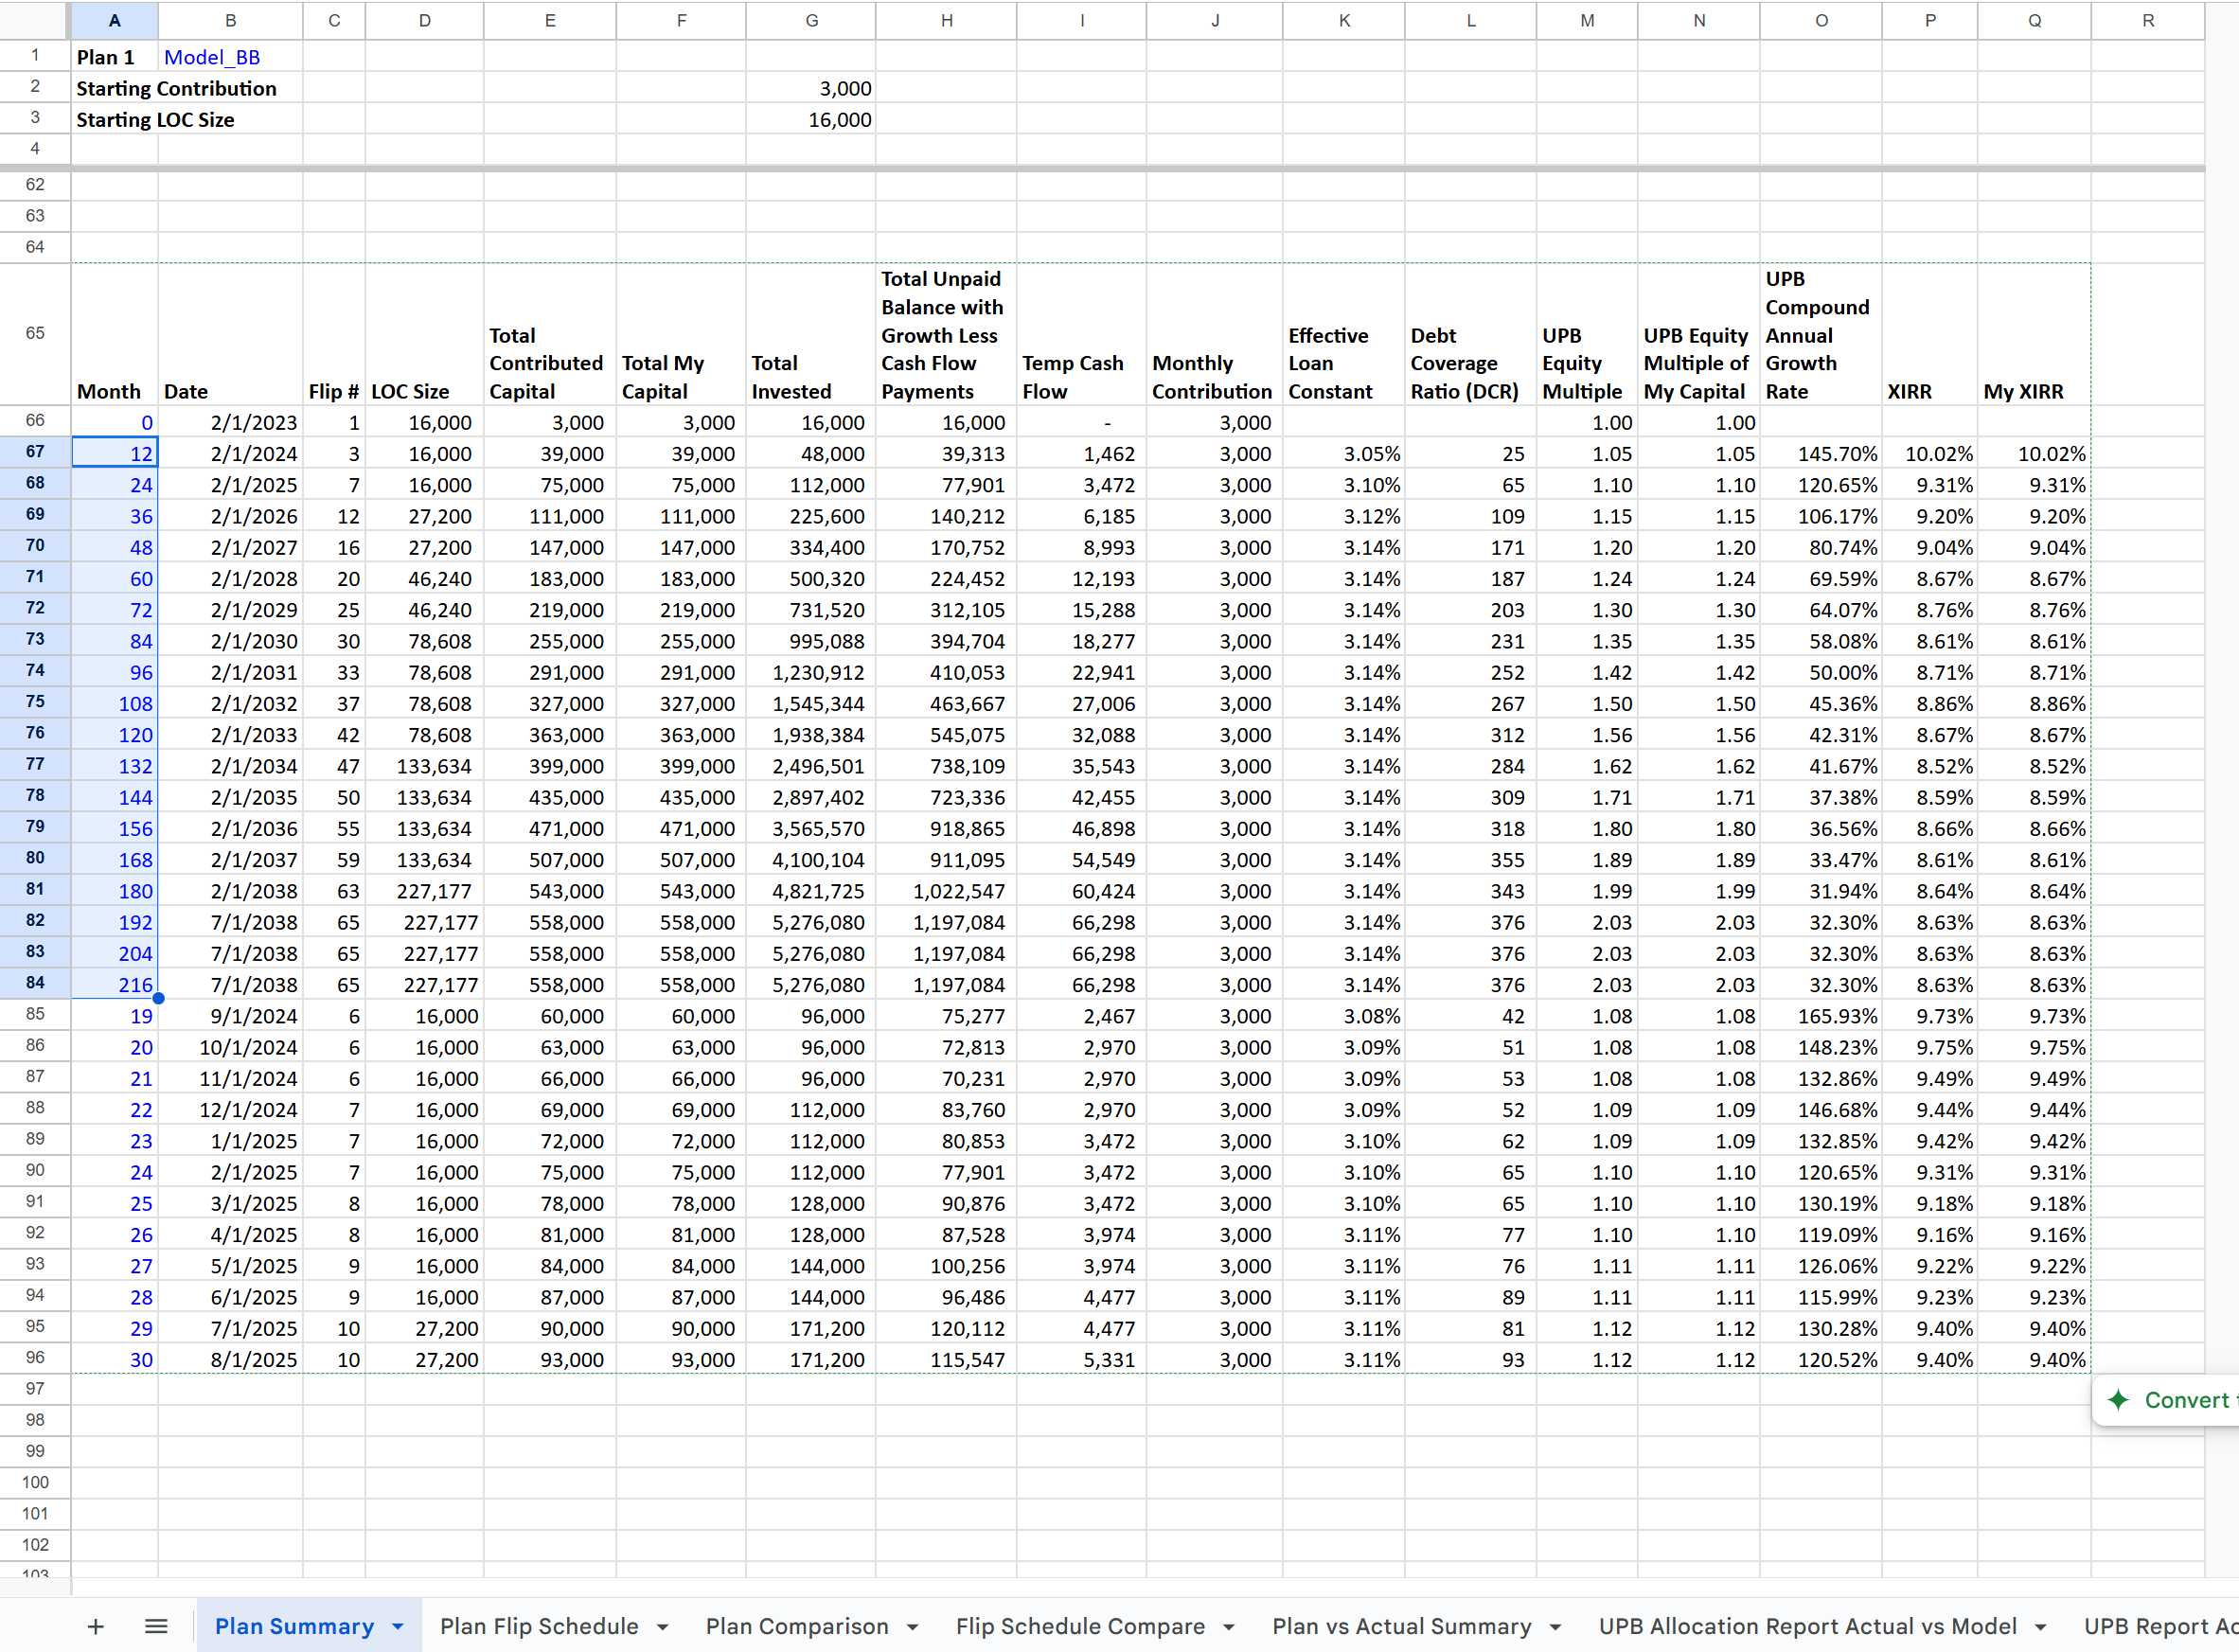
To return the data table and graphs to the annual data and the full 180 months, edit the Month column to have the values: 0, 12, 24, 36, 48, etc.
Enter 0, 12, 24, 36 vertically in the first 4 cells of the Month column (cells A66-A69) below the graphs
Then select the 1, 2, 3 cells (cells A67-A69)click and drag to extend the values down to cell A81.
If you extend too short (by letting off the mouse button before you go down far enough, just extend again until you get to A81.
If you extend too long or if there are month numbers after the data you want to graph, just put dashes in all the cells from A82-A96. DON’T delete any formulas in the rest of the data table.
Quick way to fill down dashes:
Enter a dash in cell A82.
Click on cell A82.
Hold Ctrl-Shift-DownArrow; Let go of Ctrl-Shift-DownArrow
Press Ctrl-D to copy down the dash to the selected cells
Here’s what the data table looks like after returning the timescale back to every 12 months.